DISCOVERY PROJECT
Fractals
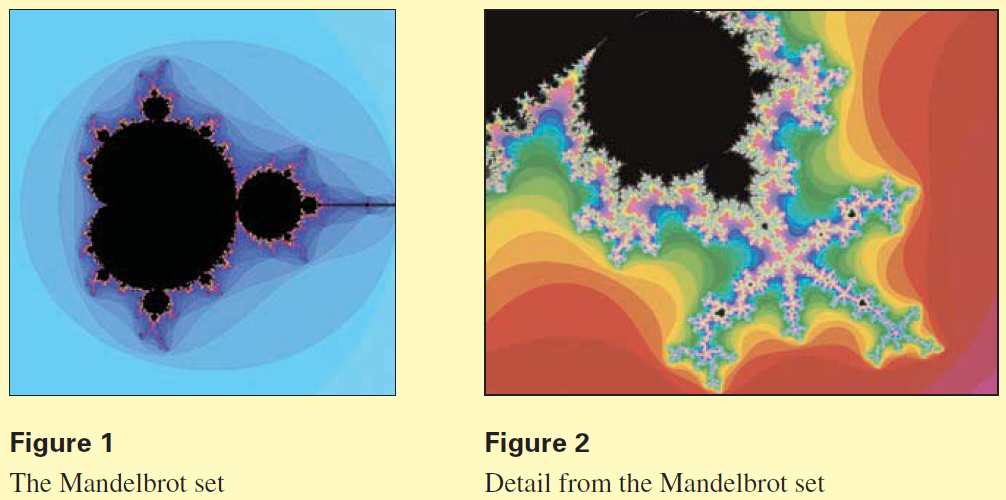
Fractals are geometric objects that exhibit more and more detail the more we magnify them. Many fractals can be described by iterating functions of complex numbers. The most famous such fractal is illustrated in Figures 1 and 2. It is called the Mandelbrot set, named after Benoit Mandelbrot, the mathematician who discovered it in the 1950s.
Here is how the Mandelbrot set is defined. Choose a complex number $c$, and define the complex quadratic function $$f(z) = z^2 + c$$
Starting with $z_0 = 0$, we form the iterates of $f$ as follows:
\begin{align}
z_1 & = f(0) = c \\
z_2 & = f(f(0)) = f(c) = c^2 + c \\
z_3 & = f(f(f(0))) = f(c^2 + c) = (c^2 + c)^2 + c \\
&. \qquad \qquad. \quad \quad. \qquad \qquad. \\
&. \qquad \qquad. \quad \quad. \qquad \qquad. \\
&. \qquad \qquad. \quad \quad. \qquad \qquad.
\end{align}
As we continue calculating the iterates, one of two things will happen, depending on the value of $c$. Either the iterates $z_0, z_1, z_2, z_3, . . .$ form a bounded set (that is, the moduli of the iterates are all less than some fixed number $K$), or else they eventually grow larger and larger without bound. The calculations in the table on the next page show that for $c = 0.1 + 0.2i$, the iterates eventually stabilize at about $0.05 + 0.22i$, whereas for $c = 1 - i$, the iterates quickly become so large that a calculator can't handle them.
| $f(z) = z^2 + 0.1 + 0.2i$ | $f(z) = z^2 + 1 - i$ |
|---|---|
| $z_1 = f(z_0) = .1 + .2i$ | $z_1 = f(z_0) = 1 - i$ |
| $z_2 = f(z_1) = .07 + .24i$ | $z_2 = f(z_1) = 1 - 3i$ |
| $z_3 = f(z_2) = .047 + .234i$ | $z_3 = f(z_2) = -7 - 7i$ |
| $z_4 = f(z_3) = .048 + .222i$ | $z_4 = f(z_3) = 1 + 97i$ |
| $z_5 = f(z_4) = .053 + .221i$ | $z_5 = f(z_4) = -9407 + 193i$ |
| $z_6 = f(z_5) = .054 + .223i$ | $z_6 = f(z_5) = 88454401 - 3631103i$ |
| $z_7 = f(z_6) = .053 + .224i$ | $z_7 = f(z_6) = 7.8 \times 10^{15} - 6.4 \times 10^{14}i$ |
You can use your calculator to find the iterates. With the $TI-83$, first put the calculator into $a + bi$ mode. Then press the $\fbox {Y=}$ key and enter the function $Y_1=X^2 + C$. Now if $c = 1 + i$, for instance, enter the following commands:
$$1 - i \to c$$
$$0 \to X$$
$$Y_1 \to X$$
Press the $\fbox {ENTER}$ key repeatedly to get the list of iterates. (With this value of $c$, you should end up with the values in the right-hand column of the table.)
The Mandelbrot set consists of those complex numbers $c$ for which the iterates of $f(z) = z^2 + c$ are bounded. (In fact, for this function it turns out that if the iterates are bounded, the moduli of all the iterates will be less than $K = 2$.) The numbers $c$ that belong to the Mandelbrot set can be graphed in the complex plane. The result is the black part in Figure 1. The points not in the Mandelbrot set are assigned colors depending on how quickly the iterates become unbounded.
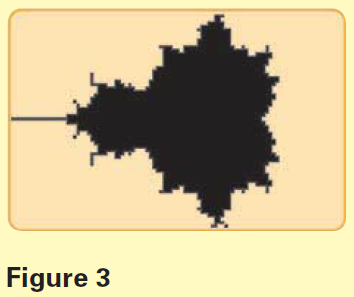
The $TI-83$ program below draws a rough graph of the Mandelbrot set. The program takes a long time to finish, even though it performs only $10$ iterations for each $c$. For some values of $c$, you actually have to do many more iterations to tell whether the iterates are unbounded. (See, for instance,Problem 1(f) below.) That's why the program produces only a rough graph. But the calculator output in Figure 3 is actually a good approximation.
| PROGRAM:MANDLBRT :ClrDraw :AxesOff |
Use the viewing rectangle $[-2, 1]$ by $[-1, 1]$ and make sure the calculator is in "$a + bi$" mode | |
| :($X$max-$X$min)/$94 \to \; H$ :($Y$max-$Y$min)/$62 \to \; V$ :For$(I,0,93)$ :For$(J,0,61)$ :$X$min+$I \ast H \to X$ :$Y$min+$J \ast V \to Y$ :$X+Yi \to C$ :$0 \to Z$ |
$H$ is the horizontal width of one pixel $V$ is the vertical height of one pixel These two "For" loops find the complex number associated with each pixel on the screen | |
| :For$(N,1,10)$ :If abs $(Z)\le 2$ :$Z^2+C \to Z$ :End |
This "For" loop calculates $10$ iterates, but stops iterating if $Z$ has modulus larger than $2$ | |
| :If abs$(Z)\le $2 :Pt-On(real$(C)$,imag$(C)$) :DispGraph :End :End |
If the iterates have modulus less than or equal to $2$, the point $C$ is plotted | |
| :StorePic 1 | This stores the final image under "1" so that it can be recalled later |
- Use your calculator as described in the margin on the previous page to decide whether the complex number $c$ is in the Mandelbrot set. (For part (f), calculate at least $60$ iterates.)
(a) $c = 1$ (b) $c = -1$ (c) $c = -0.7 + 0.15i$ (d) $c = 0.5 + 0.5i$ (e) $c = i$ (f) $c = -1.0404 + 0.2509i$ - Use the MANDLBRT program with a smaller viewing rectangle to zoom in on a portion of the Mandelbrot set near its edge. (Store the final image in a different location if you want to keep the complete Mandelbrot picture in "1.") Do you see more detail?
- Write a calculator program that takes as input a complex number $c$, iterates the function $f(z) = z^2 + c$ a hundred times, and then gives the following output:
- "UNBOUNDED AT $N$", if $z_N$ is the first iterate whose modulus is greater than $2$
- "BOUNDED" if each iterate from $z_1$ to $z_{100}$ has modulus less than or equal to $2$
In the first case, the number $c$ is not in the Mandelbrot set, and the index $N$ tells us how "quickly" the iterates become unbounded. In the second case, it is likely that $c$ is in the Mandelbrot set. - Use your program to test each of the numbers in Problem 1.
- Choose other complex numbers and use your program to test them.
- Write a calculator program that takes as input a complex number $c$, iterates the function $f(z) = z^2 + c$ a hundred times, and then gives the following output: